Information Visualization
An interactive infographic about the functionality and possible effects of a CO2 tax
Team
Vanessa Schmitt
Marcus Schindler
Alexander Giese
My Role
Whole project
Web Design
Chapter »Cash or Charge?«
Information Visualization
UI/UX Design
Prototyping
Context
Course by Prof. Boris Müller
Date
2021

The interactive infographic explains how a CO2 tax can contribute to reducing a country’s greenhouse gas emissions. We illustrate how the system could work, which products become more expensive, whether you pay extra at the end of the year or receive money and which potential such a tax could have.
For this project we were challenged to develop an interactive infographic about ways to fight climate change. Since there are only few infographics online showing how a CO2 tax could work in an accessible way, we made it our task to create a concept for an interactive website which explains the topic step by step.
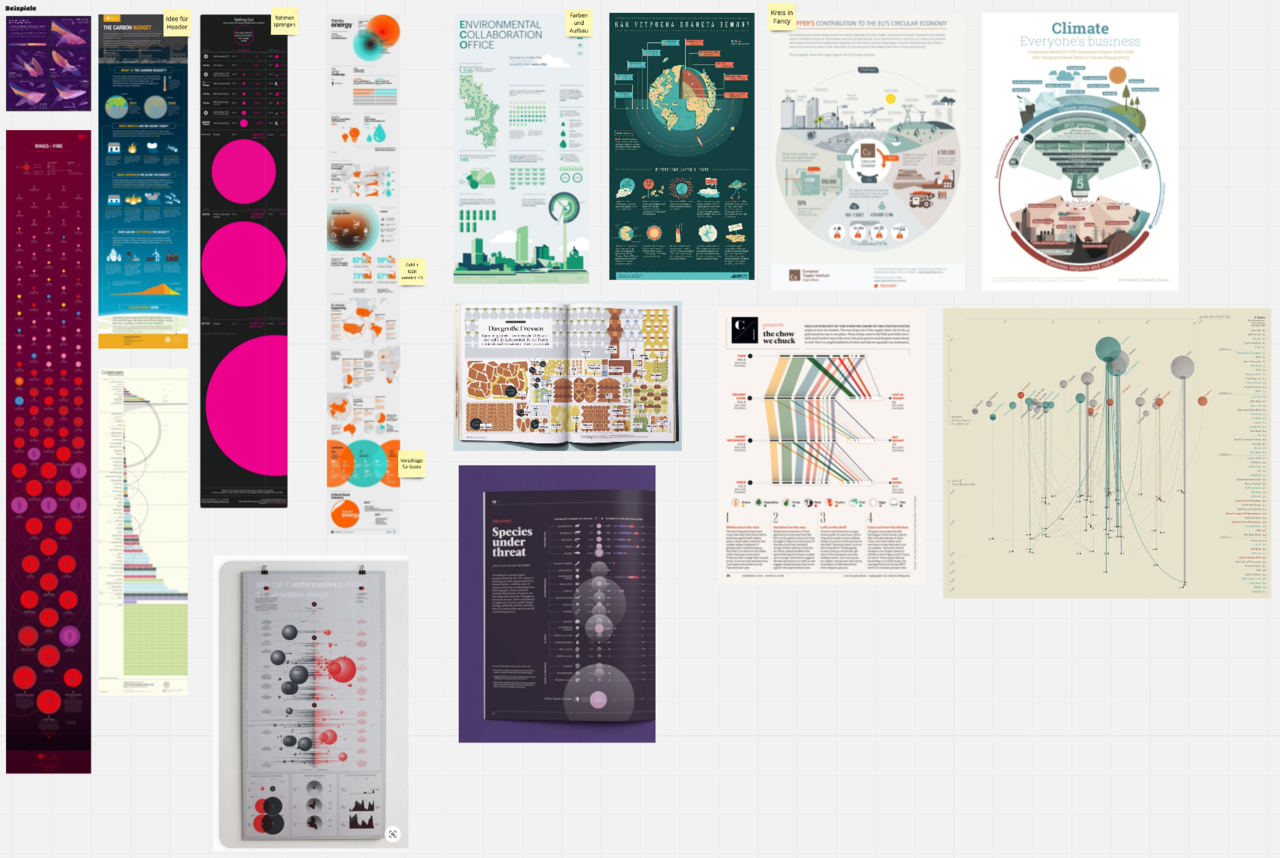
We began by researching visual styles for the infographics to clearly show cash flows, price increases, and the balance between tax revenue and refunds. Then, we created the interactions like the CO₂ price slider, enabling users to explore product price changes with real-time infographic updates. Finally, we added illustrations and guiding texts to tie all elements into a cohesive, engaging narrative.

Research for the visualization style

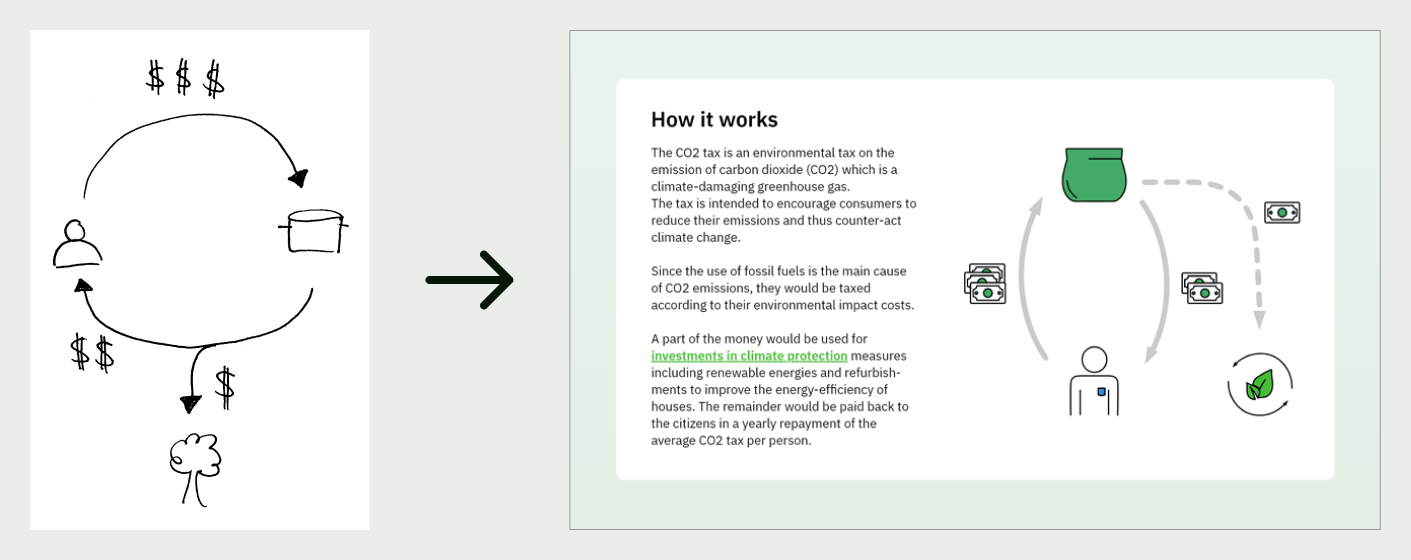
Sketch and result for the chapter »How it works«

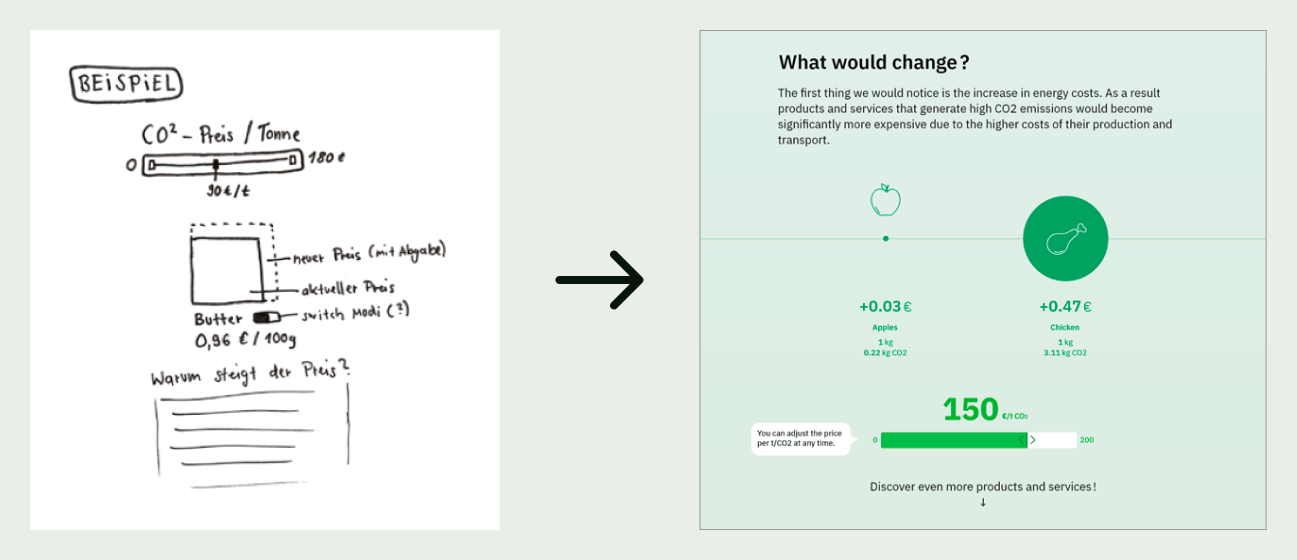
Sketch iterations for the visualization of the price increase in »What would change?«

Sketches and result for the chapter »What would change?«

Sketches and result for the chapter »Cash or Charge?«
We developed a visual concept and a prototype of the website to explain how a CO2 tax can help to reduce greenhouse gas emissions. We illustrate in more detail how the system works and compare the price increase between different products and services. At the end we demonstrate how a yearly repayment could reward a sustainable lifestyle and discuss whether a CO2 tax could change the game on a global scale.
I’m Alex, a UI/UX Designer based in Berlin with a focus on interaction design and service design.
I enjoy designing interfaces for complex processes, HR topics and I am passionate about great usability and knowledge management.